Reverse-Engineering Star Fox Adventures Live with Claude and a Dolphin MCP
I've written before about contributing to a Star Fox Adventures decompilation and about a side quest fine-tuning an LLM to decompile assembly. This is another experiment from the same project, and it's my favourite one yet.
I built an MCP server that drives Dolphin's built-in GDB debugger, handed it to Claude, and then mostly just played the game. Claude set its own breakpoints and watchpoints, read registers and memory, and toggled values live while I played — turning "what is this struct field?" from a guessing game into an experiment I could watch happen on screen. We used it to correctly rename a function and a struct field that an earlier AI pass had mis-labelled as "spirit"-related, and in the process found a piece of cut content: a damage-escalation system that never actually triggers in the retail game.
Playing the game while Claude reads its mind
The part that genuinely surprised me is best shown rather than described:
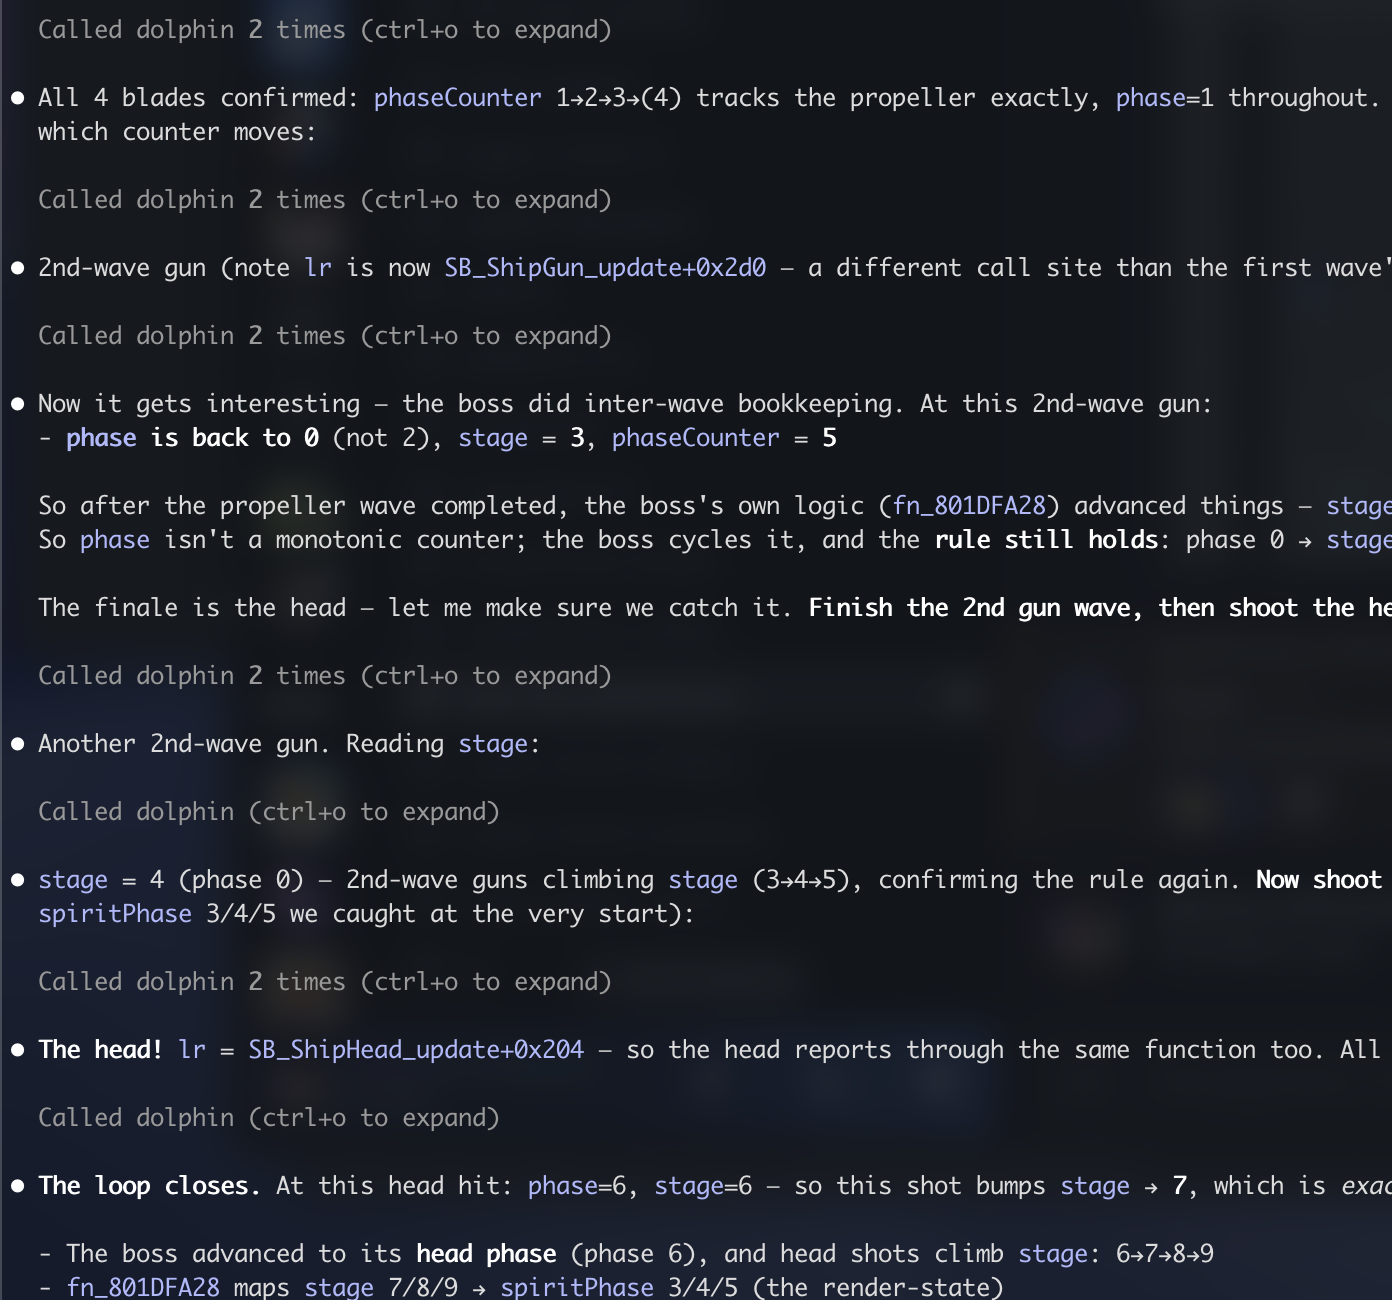
Every "Called dolphin" line in that screenshot is a breakpoint firing while I play. By that point Claude and I had already done some initial mapping — found the live object, identified the relevant memory addresses, and worked out at a broad level how the fight should progress. So for this run it had set all the breakpoints up front, and I just played the fight start to finish while it watched the live registers come back hit after hit and narrated the state machine out loud: second gun wave, now the propeller, the stage counter ticked, here comes the head. That whole stretch was completely hands-free — I wasn't prompting it between hits, just playing — and watching it confirm the entire flow unfold in one pass was the moment this clicked for me.
This is the workflow I came away loving. Instead of me babysitting a debugger — set a watchpoint, run, read r3, map the address back by hand, repeat — I describe what I want to learn, Claude drives the mechanical loop, and I provide the one thing it can't: actually playing the game and telling it what I'm destroying as I go.
The discovery loop
The target was the ShipBattle prologue, where you ride a Cloudrunner and tear apart General Scales' flying galleon — guns, propeller blades, and a dinosaur-head front — before boarding it.
Finding the live object took one instruction. Claude breakpointed SB_Galleon_update (called every frame), I flew into range, and r3 came back as the live galleon GameObject*. Following its extra pointer landed on the per-object state struct. From there the loop was always the same shape: pick a behaviour, breakpoint or watch the code that drives it, let me trigger it in-game, catch the writer or reader with its address resolved back to a real symbol, and name it.
That alone immediately fixed a bad name. A function called SB_Galleon_setScale turned out to do no scaling at all — every destructible part calls it when it dies, and it advances the fight. Renamed to SB_Galleon_onPartDestroyed.
Chasing down "spiritPhase"
The bit I actually enjoyed was a struct field named spiritPhase, commented "protection-spirit phase 0–8" — a guess from an earlier AI pass. That it was wrong was no surprise: the only context the AI had when it named these functions and fields was essentially the raw assembly, so a meaningful name like "spirit phase" was a battle it was never going to win. We went into this expecting the existing names and comments to be wrong, and treated them that way from the start.
So Claude and I worked it out from behaviour instead. A write-watch showed the field was never written during normal combat, which ruled out the health-bar theory. Forcing it to different values while boarded changed nothing on screen — though that turned out to be because the head was already destroyed by the time you board, so there was nothing left to show the effect. The breakthrough was reframing the whole thing: there is no spirit, throw out the names entirely, and derive everything from what the code actually does with the value.
Reading the consumers precisely told the real story. The guns fast-fire when the field is ≥ 3 and slow-fire otherwise; the head spawns fire particles when it's nonzero. It's a damage / "on-fire" escalation phase — it's meant to ramp up as the ship gets wrecked. But retail leaves it at 0 until the head dies, by which point everything's already destroyed, so the escalation never fires in the shipped game. A rage mechanic that never rages: effectively cut content.
The proof was the fun part. This time we tested during combat, while the head was still intact: I had Claude force the value between 0 and 5 on a five-second timer while I watched the screen, hands-free. At 5, the dinosaur head visibly catches fire — the damaged look, without being destroyed. That's a kind of evidence you simply can't get from reading code: the value, the render path, and the on-screen result confirmed in one loop.
So we renamed spiritPhase to damagePhase with an accurate comment, the misnamed getter to getDamagePhase, and the "spirit vision" cinematic events to the damage-phase toggles they actually are. Everything we committed was byte-neutral — the renames don't change a single instruction, so the unit still matches retail and the build stays green.
How it works
SFA-Decomp is a matching decompilation: C compiled with the period-correct Metrowerks toolchain to produce byte-identical output to the retail GameCube binary. That's what makes live debugging a superpower here — because the decomp byte-matches retail, the addresses in the symbol map are the live RAM addresses while the game runs. A halted program counter or an object pointer in r3 maps straight back to unit/file.c::Function +0xNN.
Modern Dolphin has no plugin API, but it ships a GDB stub that exposes registers, memory, breakpoints, hardware watchpoints, and step/continue over a TCP socket using the GDB Remote Serial Protocol. So the server is just a small, dependency-free Python program that speaks that protocol directly and exposes it as MCP tools over stdio. No external libraries, no GDB wrapper — about ten packet types plus the PowerPC register map. I've open-sourced the whole thing on GitHub if you want to point it at your own matching decomp.
The thing that makes it pleasant is that it's symbol-aware. The server loads the symbol map and the per-unit .text ranges, so every tool that returns an address resolves it. Claude never sees "PC = 0x801ee79c"; it sees SB_CloudRunner_UpdateSteer+0x134 in main/dll/SB/dll_0259_sbcloudrunner.c. That one bit of resolution is what makes the whole thing feel like reverse-engineering a conversation rather than staring at hex. When I searched beforehand I couldn't find an existing Dolphin MCP, so as far as I can tell this is new ground.
What I took away
- A matching decomp plus an emulator's GDB stub is a live oracle: the addresses are real, so the debugger turns "what is this field?" into a repeatable experiment.
- The single most valuable capability beyond breakpoints was writing memory on a timer to A/B a visual. Reading code tells you what a value should do; flipping it live tells you what it actually does on screen.
- The collaboration is the method. Claude is fast at the mechanical parts and good at forming hypotheses; I'm the one who can play the game, watch the screen, and ground its guesses in what's actually happening. I could have done all of this manually, but it would have been much slower.
I keep being surprised by how much this decomp project opens up. Building a little debugger that lets me ask the running game what it's doing — and watching Claude answer while I just play — might be the most fun I've had with it yet.